|
Video analyzer Signal/noise |
  
|
|
Video analyzer Signal/noise |
|
With this tab you can measure signal/noise ratio of the image, maximum brightness and brightness difference of the image as well.
In contrast to the similar tab of the Image analyzer, this tab doesn't require loading image file, it allows you to measure parameters of any image on the computer screen, static or live video from any third party programs. In addition, the measurements are repeated in automatic mode.
To measure signal/noise ratio, the image should contain even regions with identical brightness. The square of regions should be not less than 100 pixels. At that, the brightness of these sections should not frequent achieve black and white levels. There should be no roughness in the regions. The roughness will be sensed as noise.
It is recommended to use image without compression or image with minimal compression.
It is better to obtain images using any test chart with a gray scale, for example EIA1956.
Be attentive when measuring the signal/nose ratio of the images, which were influenced by noise reduction. Noise reduction can lead to significant decrease of image resolution. When obtaining test image, it is recommended to switch off all options of digital processing in camera.
While using CCTVCAD Lab Toolkit it is strongly recommended to check Enhance pointer precision checkbox in the Mouse Properties setting in Windows.
Order of measuring
1. Display window with live video or static image on the screen.
Video analyzer does not capture video signal by itself. It works with windows created by any other video software.
2. In video software switch off options of video compression and any additional processing.
|
3. Start Video analyzer, switch to the Signal/noise tab.
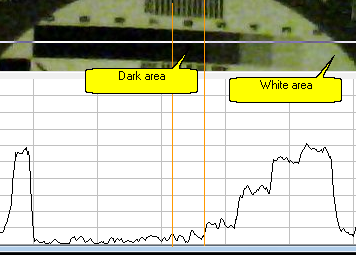
4. Click on the Setting sensors checkbox and then mark the darkest and lightest areas by two successive clicks on the image. At the points of the clicks yellow (dark area) and red (light area) squares will appear, which may disappear after a few seconds when the image changes. Video analyzer will analyze pixels inside these squares (sensors).
The squares must be placed inside even regions with identical brightness. At that, the brightness of these regions should not frequent achieve black and white levels. There should be no roughness in the regions. The roughness will be sensed as noise. Defocus.the image slightly to blur possible unevenness on the chart.
If necessary, re-click on the Setting sensors checkbox and successive specify by clicking the new places for the sensors.
You can change size of the sensors in the Sensors combobox. In most cases, the size of 10x10 (100 pixels) is optimal.
5. To start measurement, click on the Start button. Caption of the button changes to Stop.
Red and yellow squares will appear again at the specified points, and the measurement will start. The measurements will be repeated cyclically every 0,5 seconds. |
About choice of the dark area in details: The dark area must meet two requirements: 1. Noise at the area should be not be greatly restricted by the black level. 2. It should be exactly the darkest area.
With standard analog cameras it is usually enough to choose the black darkest square on the gray scale. Automation analog camera works in such a way that the black level is kept when changing the light, not cutting off the signal and noise. Complicated analog cameras with digital processing, IP cameras can behave unpredictably. Sometimes while changing light levels some of squares in the gray scale goes for the black level or rise above the black level, black level "floats." In this case we have to change places for sensors, making sure that the dark area is really darkest and the noise is not cut by the black level.
|
|
6. At the end of measurement cycle in the corresponding boxes the results will appear:
| • | Brightness - average brightness in the corresponded region. |
| • | Noise RMS - root-mean-square noise value in the corresponded region. |
On the Calculation results panel will be displayed:
| • | Maximum level of brightness; |
| • | Difference between dark and white areas; |
| • | Signal/noise ratio of the image(dB). |
The Signal/Noise ratio is calculates in the program according to the formula:
SNR=20*Log((W-D)/((Nw+Nd)/2));
where:
| • | SNR - Signal/Noise ratio (dB); |
| • | W- average brightness of pixels in the White area; |
| • | D - average brightness of pixels in the Dark area; |
| • | Nw - root-mean-square noise value of white pixels; |
| • | Nd - root-mean-square noise value of dark pixels. |
The noise is measured twice, in dark and white areas, then the mean value is calculated, to minimize a possible error caused due to the gamma correction.
Unweighted value of signal/noise ratio is calculated as in measurements without weighing filter.
To obtain weighted value add to the result 8 dB.
7. To stop measuring click on the same button with Stop caption.