|
Image analyzer TV lines |
  
|
|
Image analyzer TV lines |
|
Using this tab you can analyze separate lines, like a special TV oscilloscope.
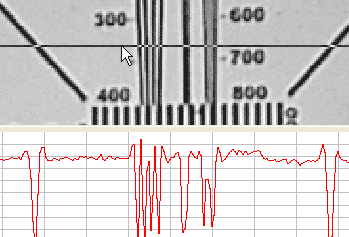
After opening the tab, the image area becomes divided into 2 parts. Above there is the image itself, and below the brightness oscillogram of the selected line is displayed.
To specify analyzing line clicks on the image. The line could be moved when mouse button is pressed.
Border between areas could be also moved up and down. Vertical size of the oscillogram area corresponds to the maximum brightness difference.
|
|
On the Grid panel you can choose horizontal and vertical grid division number.
Using Brightness, Red, Green, Blue checkboxes, you can show/hide waveform of brightness and separate color components of the image.
To save the image with oscillogram click Save.
With this tool you can measure resolution at specified contrast decreasing using the the test chart vertical wedge.
The tool is also useful for estimation of distortion, which is produced by communication lines, twisted pair transmitters, amplifiers-correctors and for carrying out of many tasks instead of special TV oscilloscope. In contrast to TV oscilloscope, this tool works with digital images and allows to analyze separate color components.