Preparing spectral power distribution curve
Determining spectral efficiency
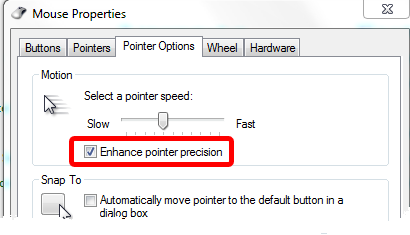
While using CCTVCAD Lab Toolkit it is strongly recommended to check Enhance pointer precision checkbox in the Mouse Properties setting in Windows.

Preparing spectral power distribution curve
To prepare spectral power distribution curve image independently of the source file format:
| • | Show a document with the curve on the screen. |
| • | Press Alt+Print Screen (prt scr on portable computers). |
| • | Run Paint (graphics editor, presented in all Windows versions). Run>All programs>Accessories>Paint |
| • | In the Paint Main menu choose Edit>Paste. In the Paint window the screenshot with the curve will appear. |
| • | Choose Selection tool and specify by selection frame the curve without margins, exactly on its borders. |
See curve example loading at starting the Spectrum analyzer.
| • | Choose Edit>Copy. |
| • | Choose File>New. Changes need not be saved. |
| • | Choose Edit>Paste. The curve will be displayed on the screen. |
| • | Choose File>Save. Enter any file name and save the curve in *.bmp format. |
Determining spectral efficiency
| • | Open Spectrum analyzer. |
| • | Click Load image. Choose the saved curve image. |
| • | Choose Light source type: Visible light or Infrared radiation. |
| • | In the Min. wavelength (nm) and Max. wavelength (nm) combo boxes enter recorded wavelength limits on the curve. |
For accurate spectral efficiency calculation of lamps emitting considerable part of power in IR range (for example, incandescent lamps), curve range should be not less than up to 1100nm.
Draw out the curve from left to right accurately, keeping the left mouse button pressed. It is possible to hold Ctrl on the keyboard.
|
Make an effort to leave minimum number of non-outlined segments.
|
In case of mistake, click Refresh image and repeat the outline from the start..
| • | On the Spectral efficiency of radiation panel, in the Image sensor type combo box choose sensor type for which the spectral efficiency is determined. |
| • | Click Calculate. After a time in the Spectral efficiency of radiation box, the determined factor will appear. |
If you have chosen Light source type>Visible light, the result would be a ratio of "number of lumens" from incandescent halogen lamp Tc=3100K, equivalent to one lumen from the test light source for the chosen image sensor.
If you have chosen Light source type>Infrared radiation, the result would be a ratio of "number of lumens" from incandescent halogen lamp Tc=3100K, equivalent to one WATT from the test infrared source for the chosen image sensor.
You can insert this factor in the Lamp calculation box in VideoCAD.
See also: What is the Spectral efficiency factor, Measuring spectral efficiency of light source
See also: Additional features.